Higher claims pushed up non-life insurers’ underwriting losses: Report
General and health insurers’ underwriting losses widened in FY22 when their incurred claims ratio worsened on account of higher claims paid because of Covid-19. Insurers reported underwriting losses of Rs 31,810 crore, an increase of 59 per cent from the year-ago period.
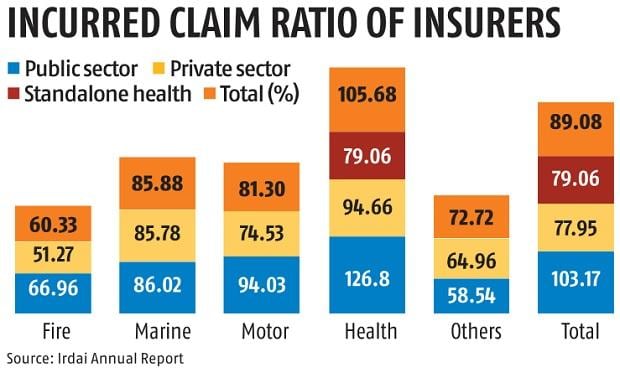
The incurred claims ratio (net incurred claims to net earned premium) of the general insurance industry was 89.08 per cent in FY22 as against 81.06 per cent in the year-ago period, according to data in the industry’s regulator annual report for 2021-22.
The net incurred claims of general insurers stood at Rs 1.41 trillion in FY22 as against Rs 1.12 trillion in the year-ago period, up about 26 per cent. The net incurred claims under the health insurance business of general and health insurers stood at Rs 63,361 crore in FY22, up about 56 per cent.
Incurred claim is the difference between the amount of claims settled by the insurers and the reinsurance support they had.
“Among the various segments, the health segment had the highest claims ratio at 105.68 per cent against a claim ratio of 89.51 per cent during previous year”, the Insurance Regulatory and Development Authority of India (Irdai) said in the report. A significant portion of the health claims are related to Covid-19.
While state-owned insurers reported an incurred claims ratio of 103.17 per cent, private ones saw this ratio rise to 78 per cent. The standalone health insurers’ incurred claims ratio was 92.5 per cent.
From a profitability point of view, the net loss of the general and health insurance industry was Rs 2,857 crore as against the net profit of Rs 3,853 crore in FY21. The investment income of general insurers has grown by 9.42 per cent in FY22 to Rs 32,546 crore, which in turn has managed to restrict the net loss number of the industry to around Rs 2,900 crore.
Among state-owned insurers, only New India Assurance was in the green. The other three, United India Insurance, National Insurance Company, and Oriental Insurance Company, suffered losses of Rs 6,926 crore in FY22. Among the 20 private general insurers, 13 reported net profit and the rest incurred losses. Out of the five stand-alone health insurers, only one reported net profit while others incurred losses.
Life insurance industry paid benefits, which include death claims, maturities, surrender/withdrawal, annuities/pensions and other claims, to the tune of Rs 5.02 trillion in FY22. Of this, death claims were to the tune of Rs 60,821 crore, up 45 per cent from the year-ago period.
During this period, profits of the life insurance industry declined by 10.5 per cent with profit after tax (PAT) of Rs 7,751 crore as against Rs 8,661 crore in the year-ago period. Of the 24 life insurers in operation during FY22, as many as 15 reported profits. LIC reported an increase in profits by 39.39 per cent while private insurers together reported a drop in profit by 35.62 per cent in FY22.
Investment income, including capital gains and other income, of the life insurance industry declined by 10.58 per cent during this period to Rs 4.17 trillion in FY22.
As of March 2022, investments made by the insurance industry stood at Rs 54.37 trillion as against Rs 49.13 trillion as on March, 2021 to register an increase of 10.65 per cent. The share of life insurers stood at 91.09 per cent, general insurers including specialized insurers and Standalone health insurers constituted 7.10 per cent and reinsurers including branches of foreign reinsurers constituted 1.81 per cent as of March, 2022.
Insurance penetration in India during 2021-22 remained same as in 2020-21 at 4.2 per cent, with life insurance at 3.2 per cent, and non-life at 1 per cent. But insurance density increased from $78 in 2020-21 to $91 in 2021-22. While insurance penetration is measured as the percentage of insurance premium to GDP, insurance density is calculated as the ratio of premium to population (per capita premium).

 Loan, Personal Loan, Home Loan, Business Loan,Loans in India Loan in India, Personal Loan, Home Loan, Business Loan, Loans in India,Loan Finance,Loan in India, Get Instant Personal Loan,Home Loan, Business Loans in India